
Water steward
Water steward is a product that tracks water usage based on home equipment and control cases of wastage. This product provides residents with clear daily activity water consumption to encourage users to have positive impacts on habits to cut down daily water consumption. It engages the users by successfully saving a certain percentage of water, and offers rewards which are discounts on the water bill or some other source of water.
BRIEF
Identify a pain point and develop a solution that could aid in solving a problem within a complex system.
DELIVERABLE
Primary & Secondary Research, Concept, System Diagrams, Brand Identity, App Prototype
TOOLS
Sketch, Adobe CC, Keynote
TEAM /DURATION
Jiaxin He - 4 Weeks / Spring 2019
KEY INSIGHT
The southern part of California is dry throughout the year with very low precipitation. Growing cities in California have challenges of water accessibility since it is used for various activities and by most people on a daily basis. Unfortunately, residential water wastage in California is a big issue. Now the society is calling people for saving water, everyone knows to save water. However, people don't really know how much water they use in their homes. People's plans to save water are based on experience or perception, but it's not reliable.
OPPORTUNITY
How might we give residents an intuitive view of their daily water use?
About 70% of the city's water use in California is residential water.
We conduct systematic research on water resources online and look for areas of interest to explore.
At the beginning of our research progress, our group looked into what are the facts that cause the wastage and shortage of water sources in California based on some data and sources that talk about water issues. Based on these studies, we found out that water is a shortage in California which was interesting for us to explore the origin of California water issues.

Water Infrastructure in California
Shannon1 at English language Wikipedia; https://commons.wikimedia.org/ wiki/File:California_water_system.jpg

Actual and Projected Population in Southern California
Metropolitan Water District of Southern California, 2015 Urban Water Management Plan Figure A.1-1

Actual and Projected Water Demand in Southern California
Metropolitan Water District of Southern California, 2015 Urban Water Management Plan Figure A.1-5
Given that agriculture represents around 80% of total water use versus 20% for urban usage (Pacific Institute 2014), and that urban water valuations are 80% higher than agricultural water valuations on average (Hagerty 2017).
"
"
Water Issues In California
https://kleinmanenergy.upenn.edu/policy-digests/water-issues-california.
"
70 percent of personal water use occurs within the home, according to a 2005 EPA study. And the biggest culprit under the roof? Toilet-flushing, accounting for 27 percent of all indoor water use.
"
Americans have no idea how much water we use — or how to conserve it
https://grist.org/climate-energy/americans-have-no-idea-how-much-water-we-use-or-how-to-conserve-it/
SYSTEM MAPPING
In order to understand and analyze the distribution of water resources and residents' demand for water, we made several system diagrams to carefully analyze the entire water system.
CONCEPT MAP

STOCK FLOW MODEL

CONNECTION CIRCLE

FEEDBACK LOOP


PRIMARY RESEARCH
After the secondary research, Our focus research shifted to household water, where residential water had a large amount of clean water being wasted. The target audience in the initiatives were California residents. We created a survey to celebrate participants who are residents living in large urban spaces: San Francisco, and Los Angeles. Choosing three participants to interview them, and they helped us research closer to reality and gave specific situations

“ I think I have saved water, but my monthly bill still exceeds my expectations. And the bill does not clearly indicate where I spend that much water.”
- Chengyuan

"Because I'm living with someone else, I can't distinguish my water consumption from my roommate. This made my attempts to save water difficult."
- Elia

"Because I didn't feel the waste of water intuitively, I didn't have much passion for water-saving. And I don't think living alone would impact water bills significantly."
- Jason
Here were some insights and potential opportunities I found:
01
Most of the residents have no idea of their daily water usage.
There is an opportunity to create a product that provides users with a clear view of water consumption.
03
The monthly water bill cannot be directly checked by residents.
There is an opportunity to convert water consumption into water bills in real-time.
02
Some people don't have a great passion for water-saving because they feel that life without water is far away from them.
There is an opportunity to facilitate peers encouraging each other by making it a social norm.
04
Residents cannot immediately detect water pipe leaks, which cause a large amount of water to be leaked and wasted.
There is an opportunity to provide automatic notification or repair service to remind users.
SYSTEM MAPPING
In order to understand and analyze the distribution of water resources and residents' demand for water, we made several system diagrams to carefully analyze the entire water system.
CONCEPT MAP

STOCK FLOW MODEL
CONNECTION CIRCLE
FEEDBACK LOOP

ICEBERG DIAGRAM

JOURNEY MAP

How might we
give residents an intuitive view of their daily water use?
After studying the system, we came up with a statement that we set out to solve.
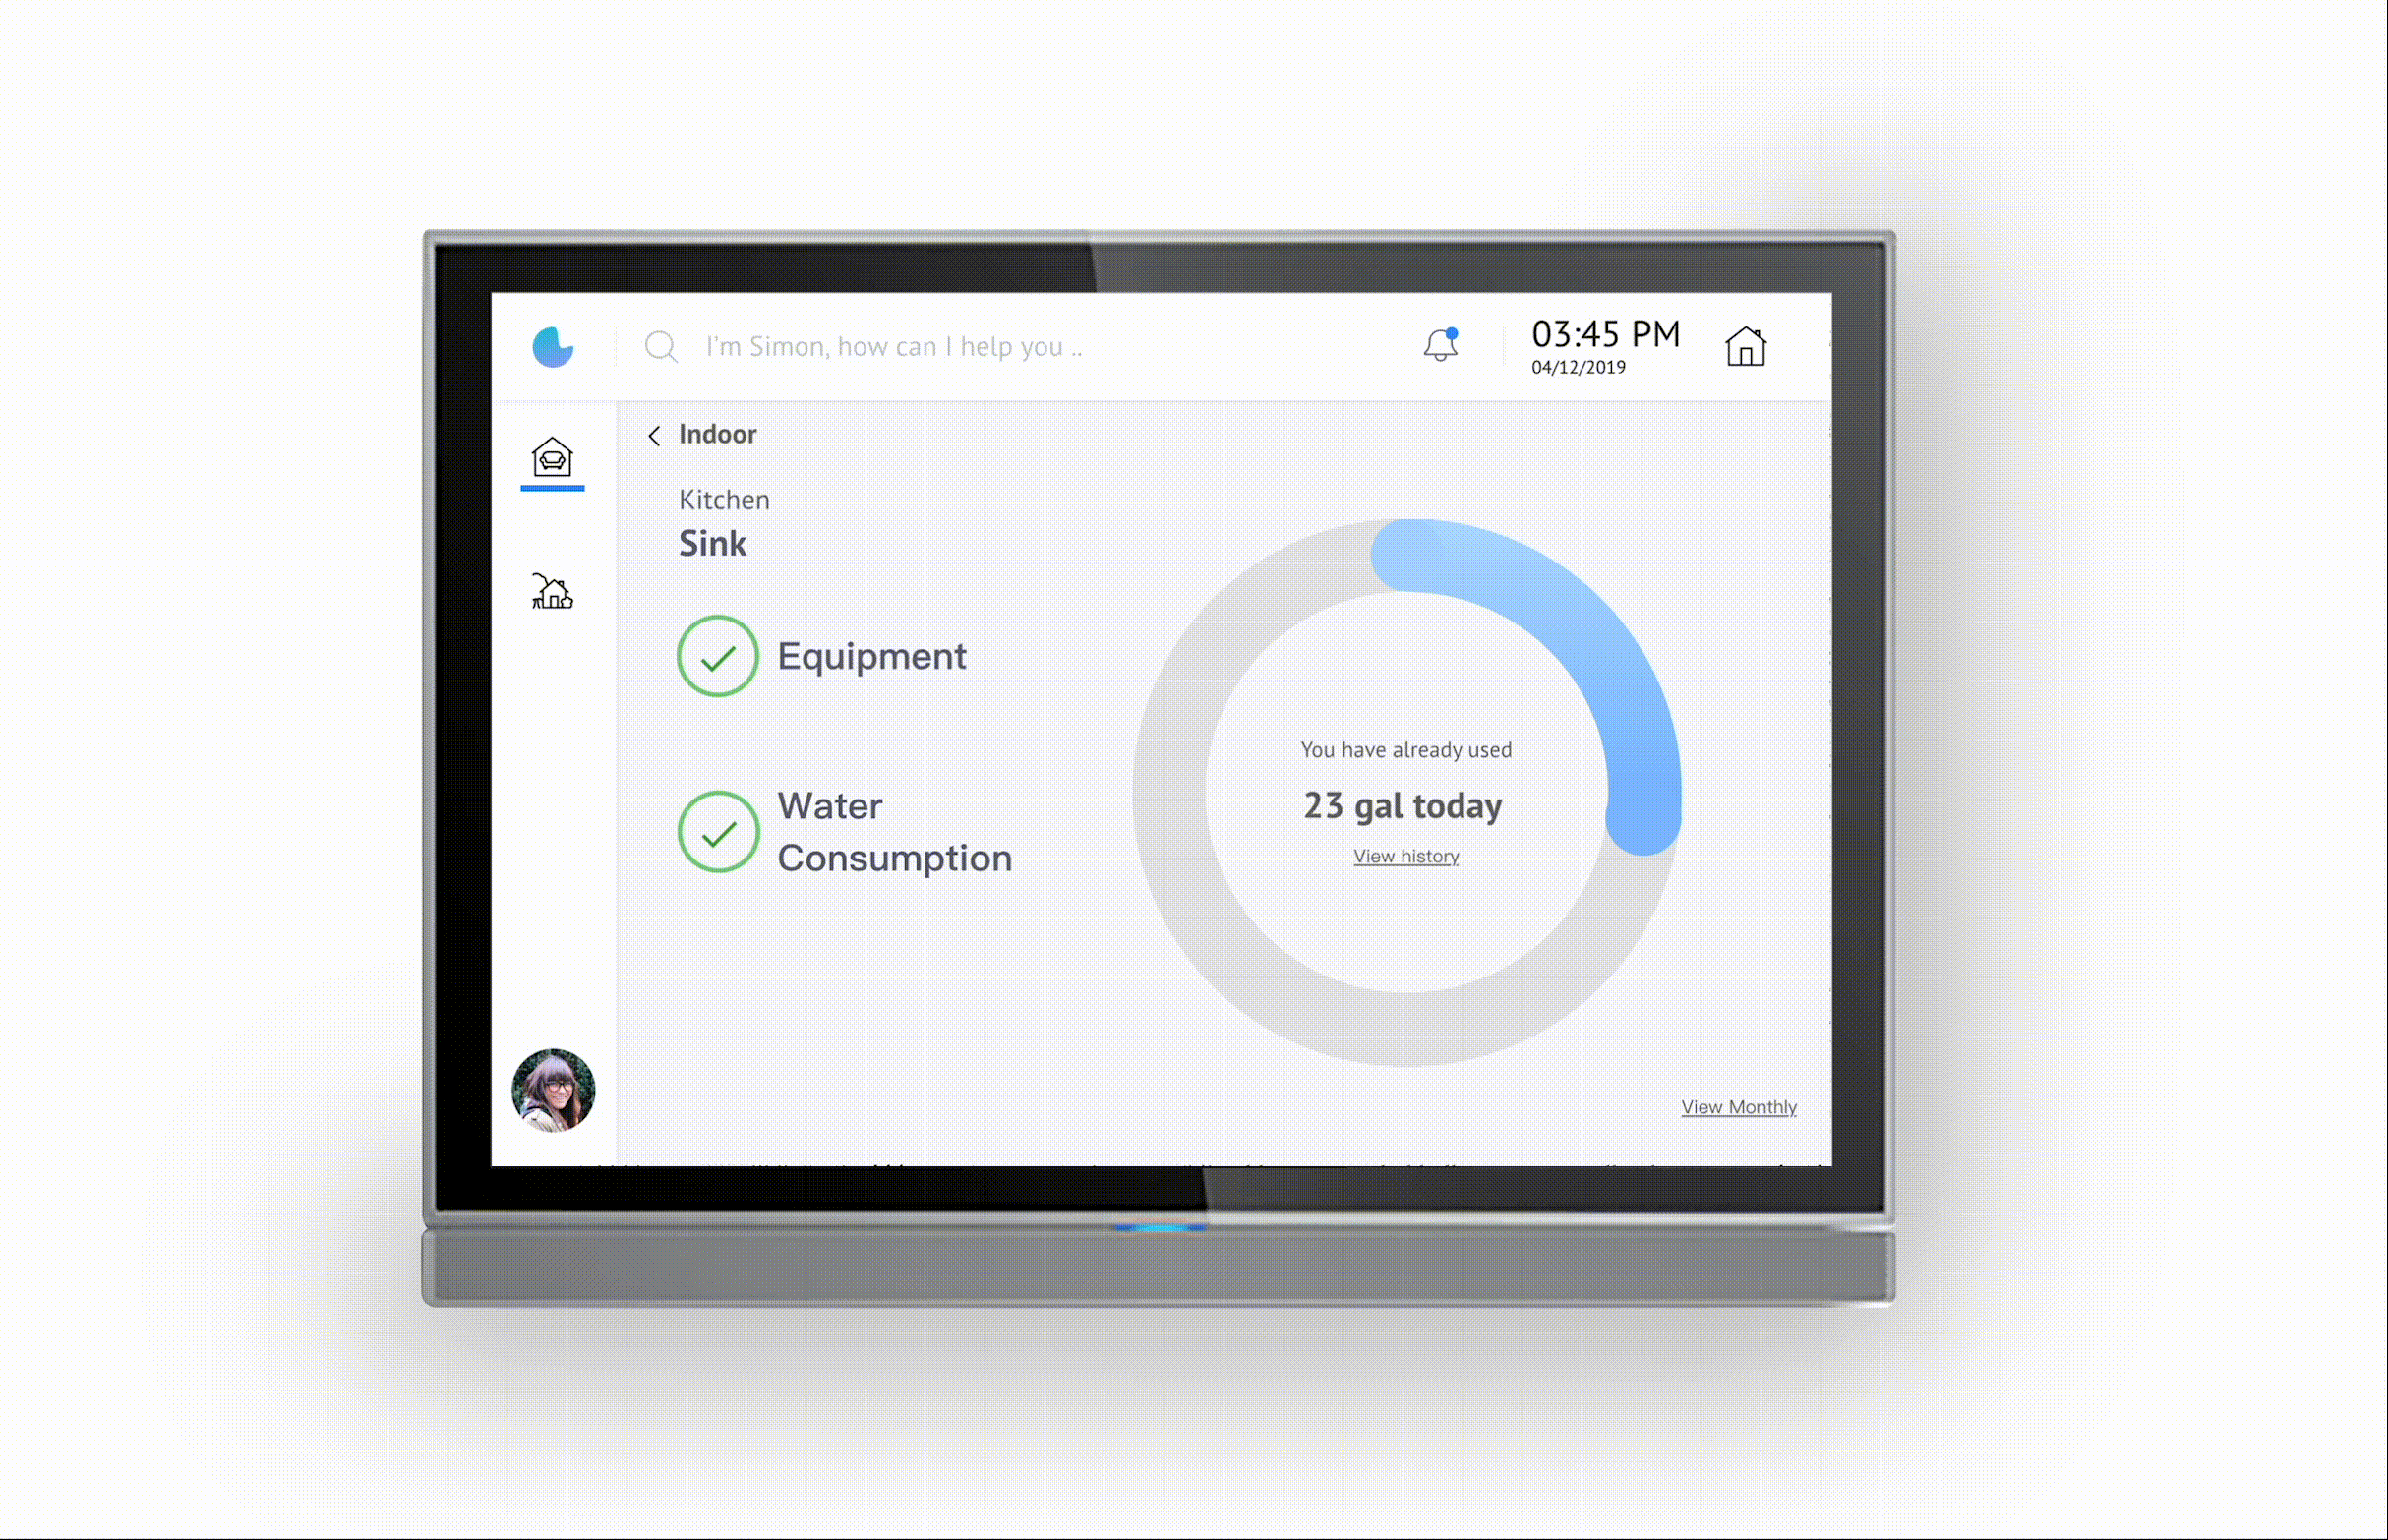
SOLUTION
The leverage point of the system we chose is information transfer. We created a home real-time tracking water equipment that could transfer the details of their activities to users and let them know of their wastage.

01
Touchable Screen
Installing the display on the wall for users to check water usage at any time at home.

The system calculates the current water charge based on current water consumption and encourages users to reduce water consumption costs. Users could also be rewarded for saving water. This reward will be a discount on the water bill or some other source of water.
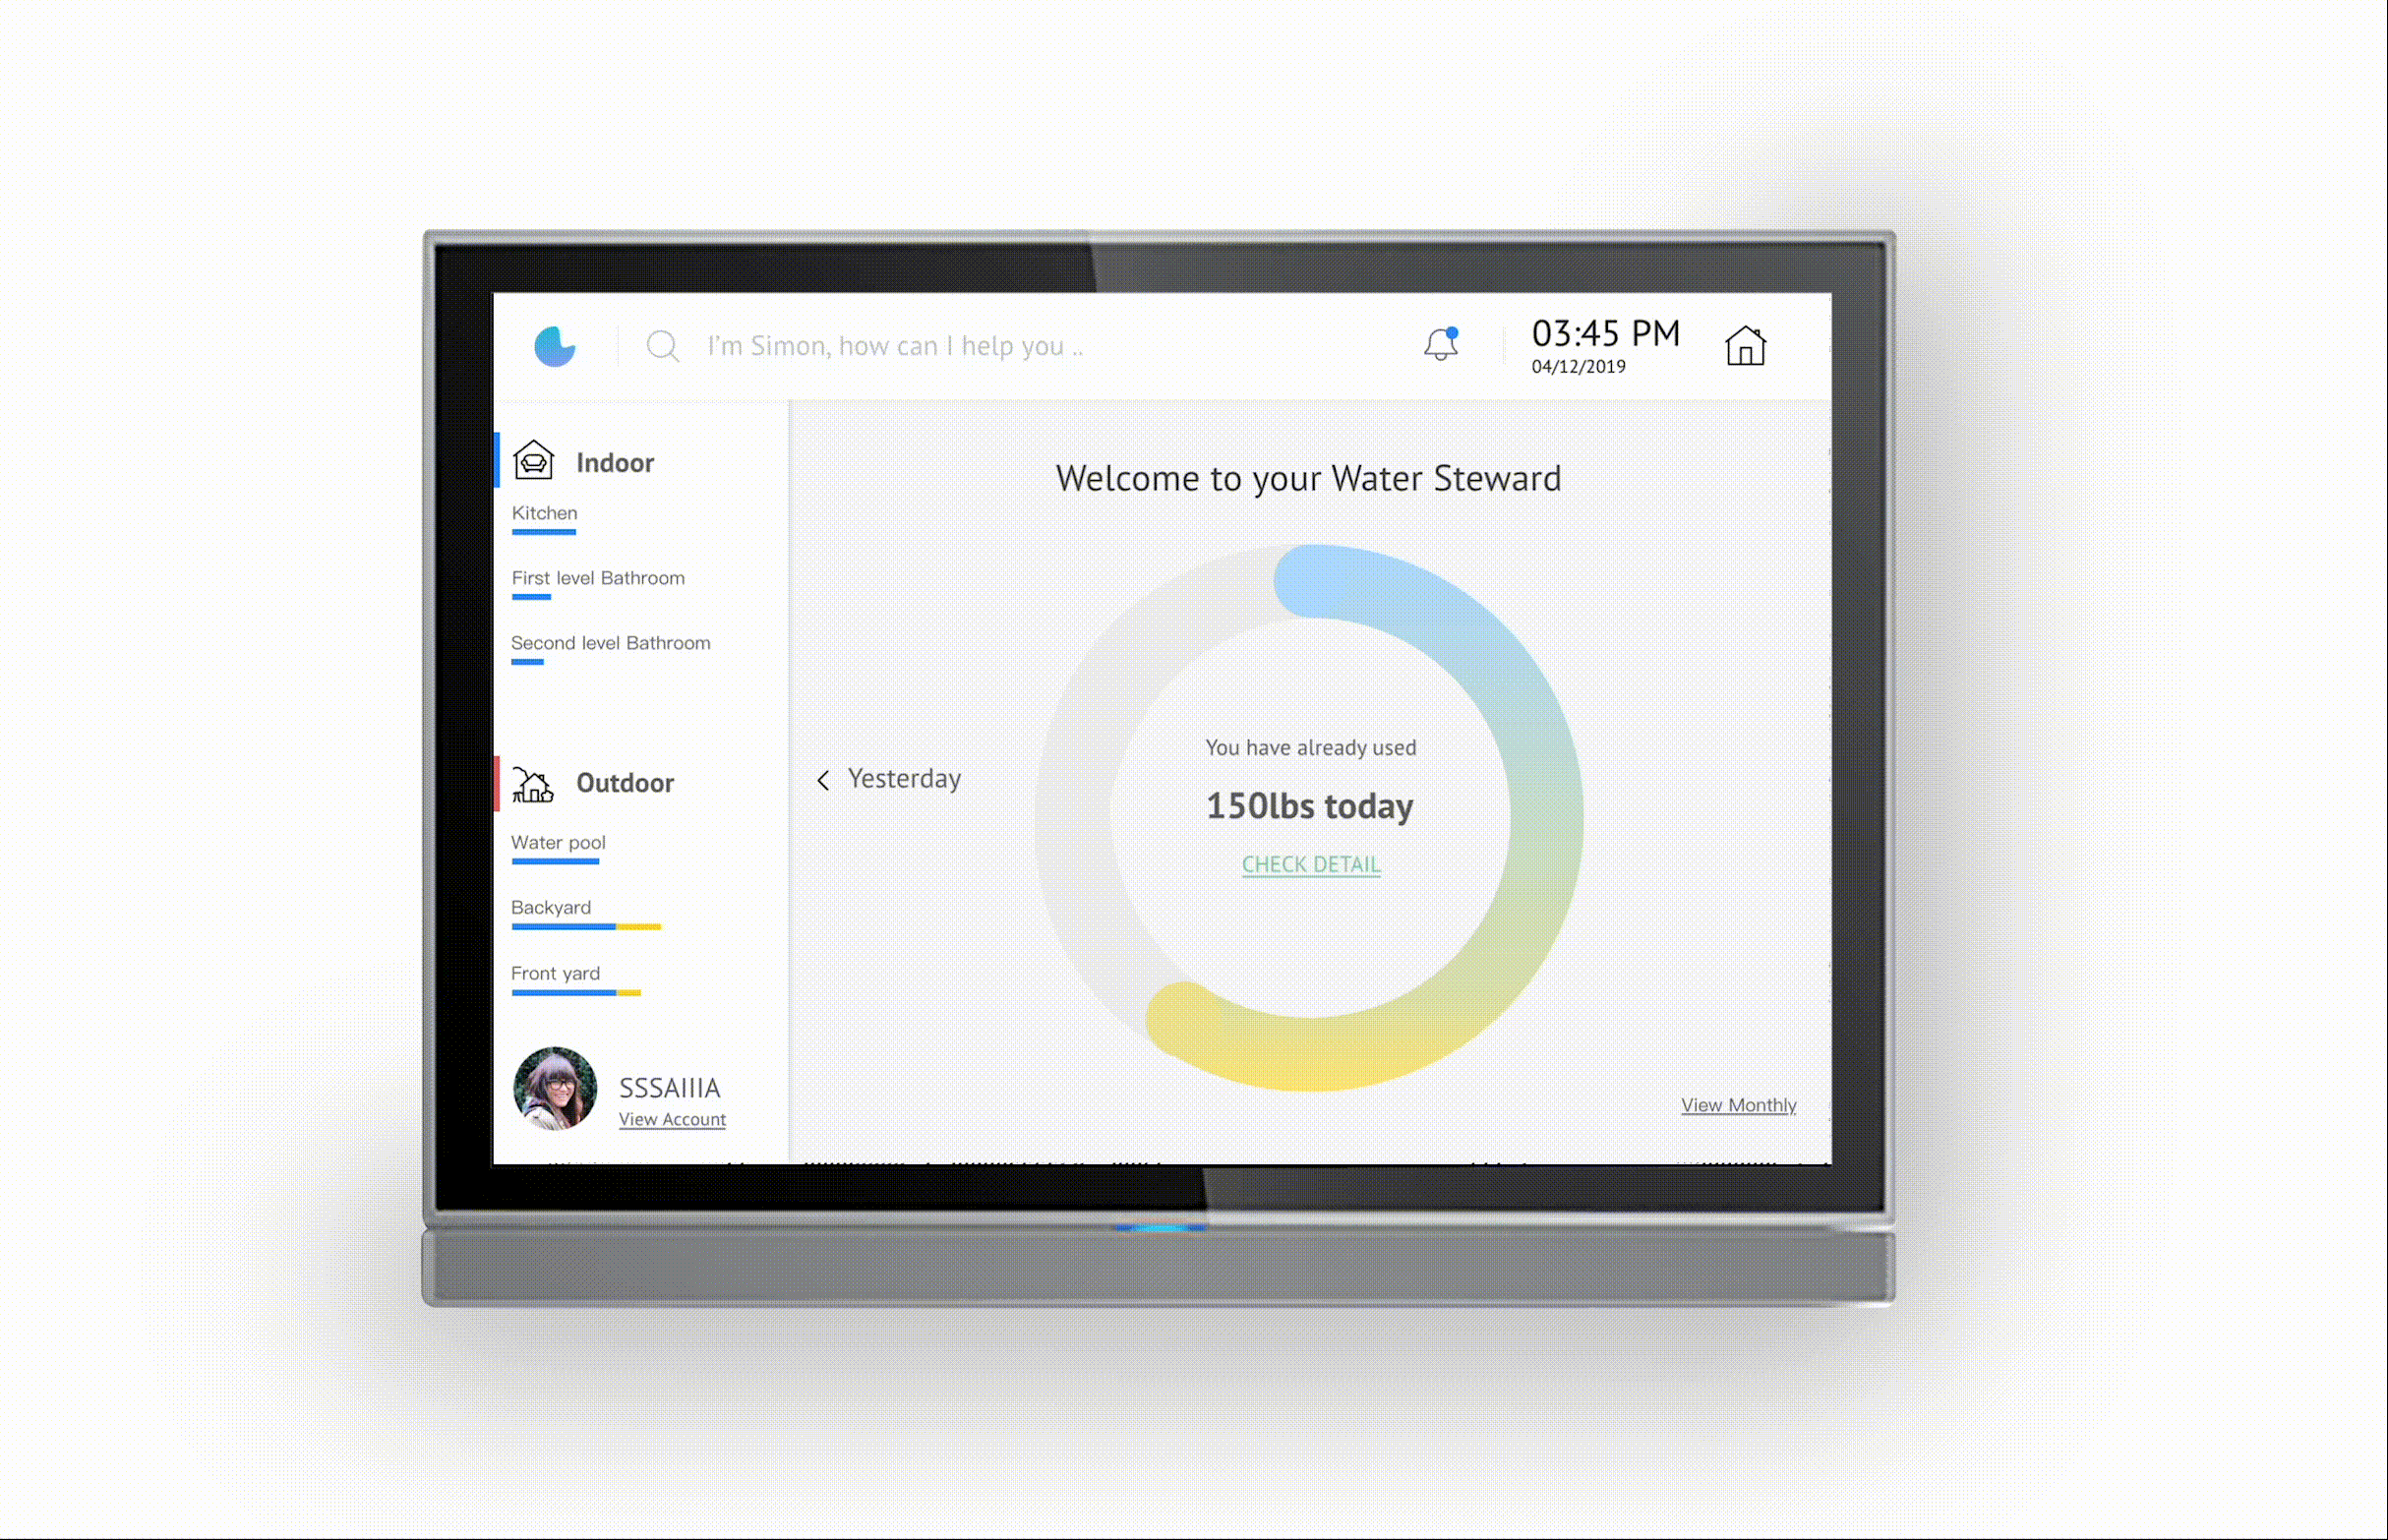
The main interface can view the short-term and long-term history of water use.
The system helps users to keep informed of the damage of water pipes in the home and avoid unnecessary waste. If the water pipe is abnormal, the system will also remind users to repair the damage as soon as possible. The system will also recommend workers who can help with the repair.

The slide circle shows the total water consumption of all devices in the home currently. This device could help users reduce the number of wasted water by providing users with the usage and history of each water pipe in the home.
02
Water Consumption Detection Sensor
Sensors are installed on all water pipes in the home to help the system monitor water usage. The LED lights on the sensors will change color due to the increase in water consumption, which helps users visually observe the increase in water consumption.


03
Poster / Advertising
Attracting potential users and calling attention to invisible water waste to increase user enthusiasm for water conservation.
REFLECTION
Affecting change in a complex system is not easy. It requires understanding the complexity of any given system, identifying the parts and how they work together, what the pain points are, how people benefit (or not) from these systems, and how things change.
If we had more time and resources, we will develop mobile applications. Connect the system to mobiles so that users can check water usage and exceptions anytime, anywhere. At the same time, we will also pay attention to the problem of wastewater reuse and find solutions, so as to create a perfect domestic water cycle system.